How To: Analyse Budget Figures
Note: the Budgets functionality needs to be enabled by ticking the 'Profit and Loss: Nominal Account Budgets' option in the Accounts section of System Values.
- Open an Accounts screen.
- Open the
[ Profit & Loss ]tab. - Tick the "Show Budget" check-box.
- Click on the "Go" button.
Note: The radio buttons can be changed at the top of the screen to show the figures on a monthly, quarterly or annual basis. Remember to click on "Go" to refresh the screen when selecting a radio button.
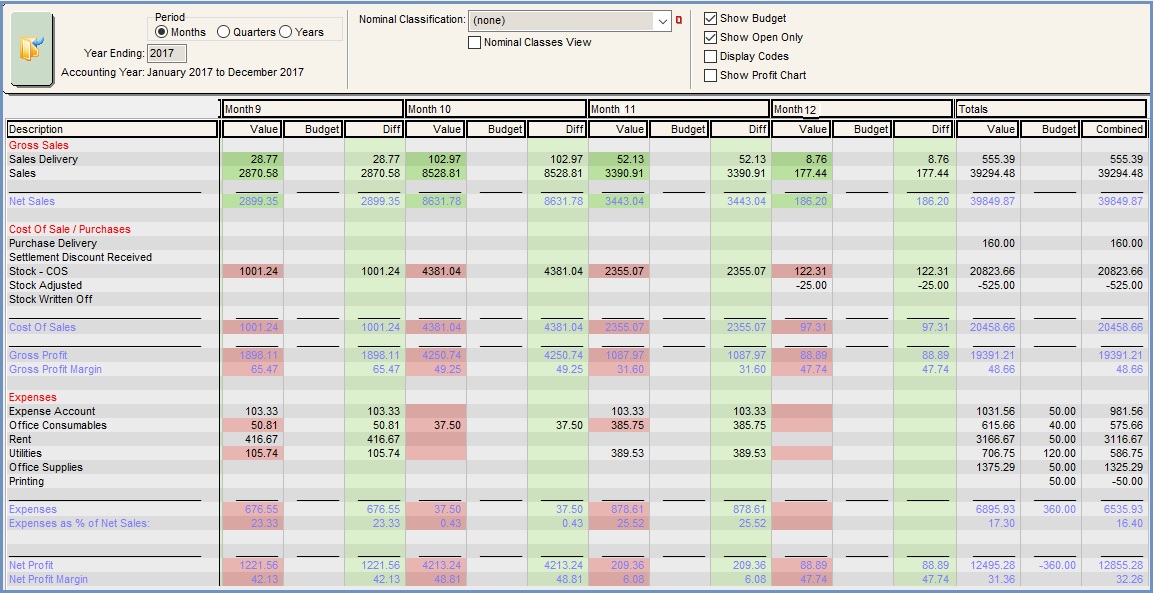
Information contained in the Screen
- Diff: calculated based on the difference between the budget and/or value column.
Notes:- If the difference is 0.00 it is left blank.
- Pink background:
- with Positive amount: exceeded the budgeted cost or expense.
- with Negative amount: failed to reach income that was budgeted.
- Green background
- with Positive amount: exceeded income budget.
- with Negative amount: expense or cost is less than budget.
- The Gross Profit is calculated for the budget column in the same way as the 'value' column is currently calculated i.e. Sales - Cost of Sales = Gross Profit.
- The Gross Profit Margin is calculated for the budget column in the same way as the 'value' column is currently calculated i.e. (Gross Profit/Sales) * 100.
- The Net Profit is calculated for the budget column in the same way as the 'value' column is currently calculated i.e. Gross Profit - Total Expenses = Net Profit.
- The Net Profit Margin is calculated for the budget column in the same was as the 'value' column is currently calculated i.e. (Net Profit/Net Sales) * 100.
- If stock is adjusted there maybe a net gain displaying as a negative cost figure as the stock was received in but without a creditor.