
Print Grid
What is Print Grid
Print Grid allows the user to display a report listing the information in the grid. The information from the grid can be displayed according the user's requirements. Once the report is displayed it can then be printed or converted into a pdf. The Print Grid option is available from any grid within Khaos Control.
Print / Export grid user permission
To prevent unauthorised printing or exporting of grids:
- Open a System Data screen.
- Double click on
[ System Data | Others | Users ]. - Select the user, right-click and select 'Edit User Permissions' from the Context Menu.
-
 Untick the 'Print/export grid' checkbox.
 - Click 'OK'.
Benefits of Print Grid
The information that is presented in the report can be configured as per the users requirements. For example the font size / type can be altered or the user can define which columns should be displayed. This option can either print a selection of items from the grid, or if no selection is made all items in the grid will be selected.
Examples of where printing a grid would be helpful include:
- Stock takes in the
[ Stock | Adjustments ]tab. - Sales Orders in the
[ Sales Orders | List ]tab. - Reports in the
[ Sales Summary ]screens. - Banked and not banked items in the
[ Bank Accounts ]screen.
Where is Print Grid?
Print Grid is accessed by clicking on the ![]() Grid Menu button, found to the left of grid column headings, and then selecting
Grid Menu button, found to the left of grid column headings, and then selecting [ Print Grid ] from the drop-down options.
Print Grid Popup
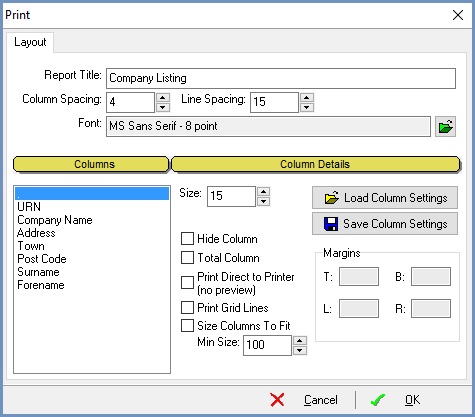
The Print Grid popup has the following options:
- Report Title: the system generated of user defined (entered after clicking the Print Grid option) title for the report. The Report Title can be changed here.
- Column Spacing: the spacing between columns in the report in millimetres.
- Line Spacing: the spacing between the lines in the report in millimetres.
- Font: the Font filed displays the font to be used in the report. To change the font, font style, size and Script, click on the
 green folder button.
 - Columns: the columns field displays all the columns headings in the grid that is bring printed.
- Column Details:
- Size: the size (width) of each column in millimetres.
- Hide Column checkbox: allows the user to hide the selected column from the report.
- Total Column checkbox: will total any selected numerical column in the report.
- Print Direct to Printer (no preview) checkbox: will not display a preview of the report and will load the Print dialog so the user can print the report or save it as a pdf.
- Print Grid Linescheckbox: shows separating lines between columns and rows on the report.
- Size Columns to Fit checkbox: allows the user to alter the width of the columns on the report. This works in conjunction with the Min Size field, below.
 : opens the Load Grid Layout Parameters dialog allowing the user to view any previously saved grid layouts. The required grid layout can then be loaded. The popup is filtered by user and lists the following information about the layouts:
- Report Title: the titles the report layout was given.
- User: who created the layout.
- Date Created: the date the layout was first created.
- Date Modified: the date any modifications were made to the report.
- Matches Grid checkbox: indicates whether the report settings are tied to the current grid. If unticked it is a generic report.
 : allows the user to save any column settings. The settings must be configured before this button is used.
- Margins:
- T: top margin of the report in millimetres.
- B: bottom margin of the report in millimetres.
- L: left margin of the report in millimetres.
- R: right margin of the report in millimetres.
Examples of Using Print Grid
Creating a new layout
To print a report listing all the sales orders in a specific date range without the Order Dates (Created, Delivery and Sent) showing and totalling the Order Amount:
- Open the
[ Sales Orders | List ]tab. - Select the date range using the date range filter in the top right, for example 1 February 2016 to 28 February 2016.
- Click on the Sales Order Type column to sort the types of sales order.
- Green-select the S Type (Sales Orders) in the grid.
- Click on the
 button.
 - From the options select 'Print Grid'.
- Change the Report title by adding the date range for example, Sales Order Amounts - February 2016.
- In the Columns area:
- Focus on Type and
 tick the Hide Column checkbox.
 - Focus on Created and tick the Hide Column checkbox.
- Focus on Delivery and tick the Hide Column checkbox.
- Focus on Sent and tick the Hide Column checkbox.
- Focus on Amount and ensure that Total column is ticked.
- Focus on Type and
- Click on the button and then OK in the information popup.
- Click on OK and view the report.
Notes:
- You may wish to make changes to the margins and line and column spacing depending on the information contained in your grid.
- The Total of the Amount column will appear on the last page in the report.
Using a previously saved layout
To use the report layout created with a different set of dates:
- Open the
[ Sales Orders | List ]tab. - Select the date range using the date range filter in the top right, for example 1 February 2010 to 28 February 2010.
- Click on the Sales Order Type column to sort the types of sales order.
- Green Select the S Type (Sales Orders) in the grid.
- Click on the button.
- Click on the button.
Note: once you have created a layout for a screen then you don't need to use this option as the Load Grid Layout Parameters dialog will automatically appear allowing the user to select the layout they require: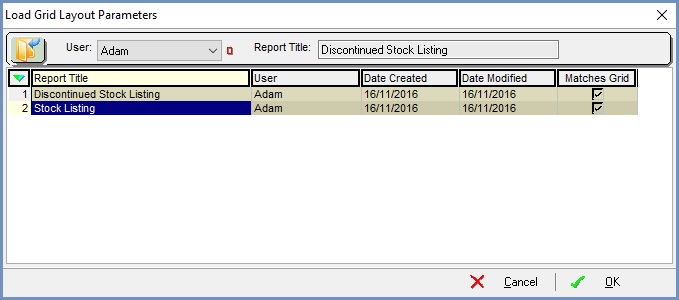
Note: you can delete layouts from the popup using the right click context menu option. - From the Load Grid Layout Parameters popup double-click on the report layout required.
- Click on Ok in the information popup and check that the layout has been loaded.
- Update the report title.
- Click on OK and view the report.