
Sales Summary - Charts
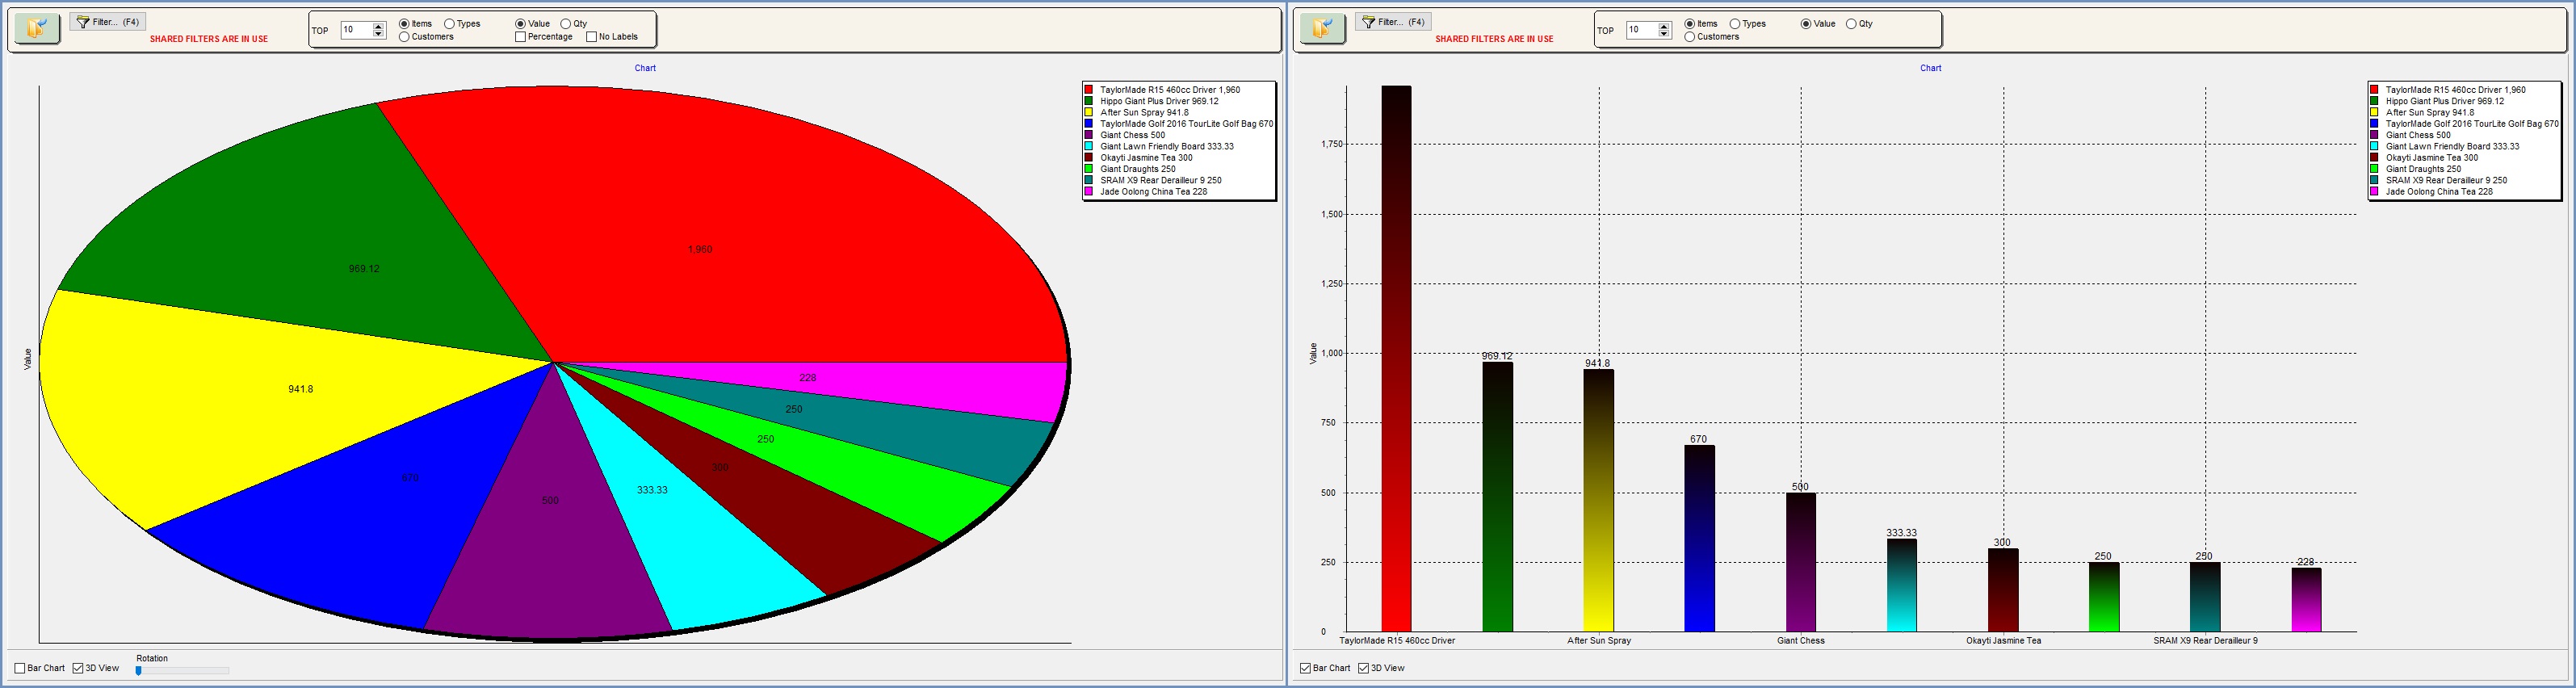
The Charts tab allows users to view stock or customer sales visually using the filters available. The chart is displayed in the middle of the screen and can be formatted using the options at the top of the screen and the display options at the bottom of the screen. The Go button must be pressed to populate the grid if the ![]() has not been used.
has not been used.
The charts can be printed, see How To: Print Sales Summary Charts.
Available Filters
The following filters are available on the Charts tab using the ![]() button:
button:
- Brand: shows orders from the selected brand only.
- Classification: only show orders where the customer belongs to certain classifications.
Note: users can select more than one option and are also able to invert their selection. - Date Range: show orders from a particular date range.
- Keycode: only show orders with a particular keycode recorded against them.
- Keycode (source keycode): only show orders with the chosen keycode recorded at the time of customer creation.
- Sales Source: show orders with a certain source recorded when the sales order was taken.
- Stock Code: only show orders containing a specific stock item.
- Stock Type: only view items belonging to the selected stock type (level 2)
- Stock Type Pack Inclusion: works in combination with Stock Type (level 2) filter as follows:
- Item Stock Type Only: the Stock Type filter applies to the Sales Order Item's stock type.
- Parent Stock Type Only: matches by the Sales Orderr Item's parent's Stock Type only, so only pack children items will be returned (and only when their parent's stock type matches).
- Both: will return all the Sales Order Items with either Stock Type or their parent's Stock Type (in case of children) matches.
- URN: Customer URN
Chart Options
The following filter options are available above the display area:
- TOP: used in conjunction with the spinner enabling the user to view the top # stock items or customers.
- Radio buttons:
- Items: stock items.
- Types: level 2 stock types.
- Customers: display the information showing the customers.
- Value: the chart displayed as values.
- Qty: the chart displayed as quantities.
- Checkboxes (pie chart only):
- Percentage: the chart displayed as percentage of the total.
- No Labels: removes the labels.
Display Options
- Rotation: the chart can be rotated using the slider.
- Bar Chart: changes the chart into a bar chart.
- 3D View: gives the chart a 3D effect.