KPI Dashboard Example - Counting Orders By User
Example Scenario
In this example we want to create a KPI dashboard which will show us the number of orders dropping into the Staging stage of Sales Invoice Manager based on the user who created the sales order.
Filtering the Screen
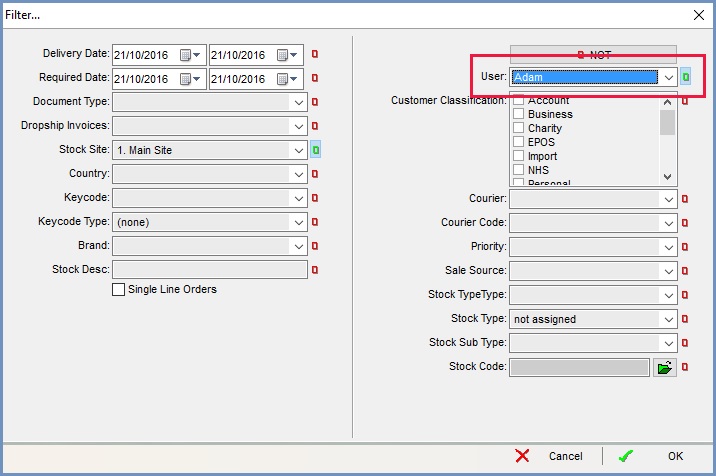
After opening Sales Invoice Manager we need to select the Staging stage and, using the ![]() button, filter the results on the first user we want to report on.
button, filter the results on the first user we want to report on.
Add To Dash
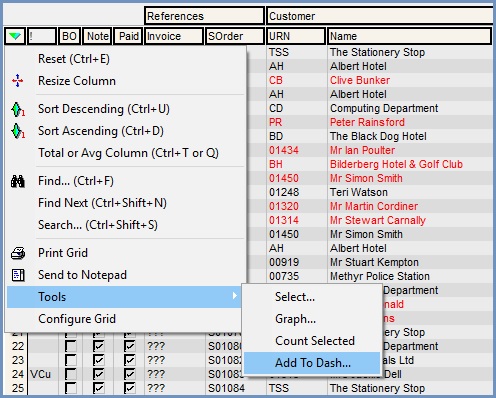
Once we have filtered the results in the grid, we can select 'Add to Dash' from 'Tools' in the grid menu.
Note: there must be data present in the grid for the following steps to work.
This will open up the 'Add Dash Item' dialog, which we can complete as follows:
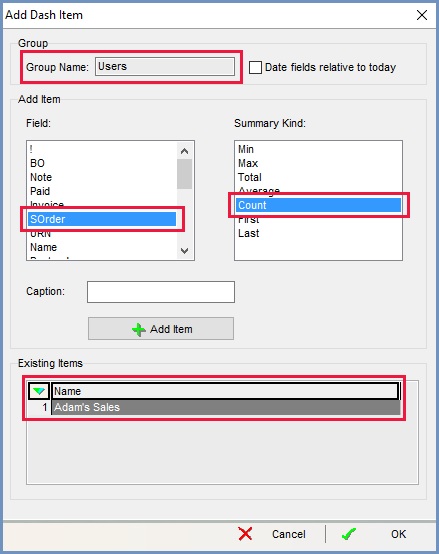
We have created a group named 'Users' and we have then highlighted the field 'SOrder' and set the Summary Kind to 'Count' to count the number of individual sales orders. In the 'Caption' box we have entered the name of the User we have filtered on and then clicked the 'Add Item' button to load it into the existing items area. We can then close the dialog, filter the grid on the next User we want to report on and repeat the process for adding the data item to the dashboard, using a different group name (e.g. Users 2).
Once we have added all the data items we want to report on, we select 'Configure Dash' from the Dash menu.
Configure Dash

Clicking on 'Configure Dash' will open up the Configure Dash Display dialog.
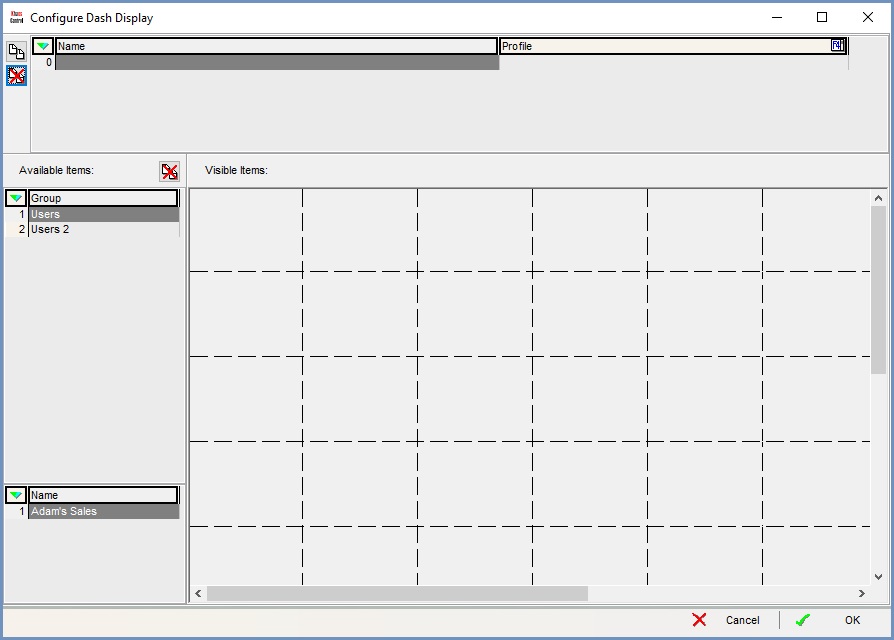
We first need to add a new line and name our dashboard

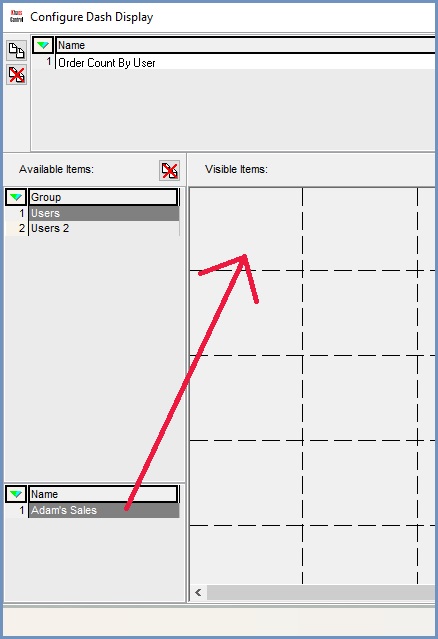
By selecting the first Group we created earlier we can drag and drop the data item into the grid. We can then repeat for the other groups we have created.
We should now have something like this:
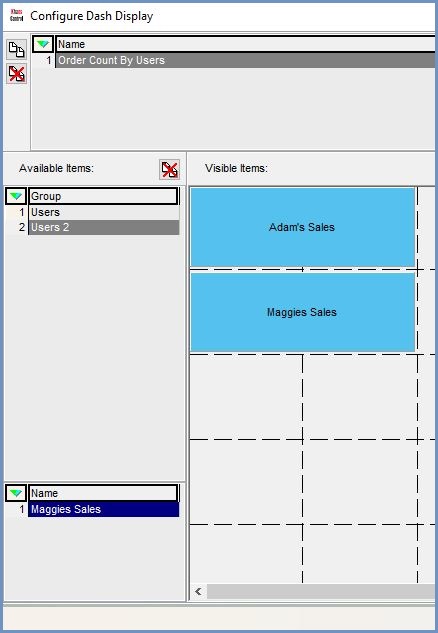
Click on 'OK' to close the dialog.
Result
To view your dashboard, go to the file menu and select it from the 'Dash' sub-menu.

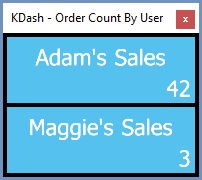
The dashboard will then be displayed. It can be resized and repositioned as desired. The one we have just created looks like this:
