Viewing Monthly Sales Data in the Standard Re-Ordering Screen
Overview
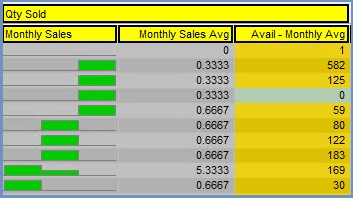
New fields have been added to the [ Stock | Reordering | Reordering (Standard) ] screen including a chart of the previous 3 months sales, and a coloured stock field to indicate if you are understocked, overstocked, or at the correct stock level.
Usage
The [ Stock | Reordering | Reordering (Standard) ] screen has three additional columns:
- Monthly Sales: this bar chart is split into 3 parts:
- First is the number of items sold of the stock item for today and the last 30 days for all sites.
- Second is for those of the last 31 to 60 days.
- Third is for those of the last 61 to 90 days.
- Monthly Sales Avg: this is the average number of items sold per month over the last 90 days.
- Avail - Monthly Avg: the current quantity of the stock items available compared to the number required on an average month from the last three months. The formula for the colour (Avail - Monthly Avg) will is (sum(available) - ((sum(qty_sold in past 90 days)/3))

Colour Legend
- Amber AVAIL - MONTHLY AVG: based on monthly sales avg, available stock is OVERSTOCKED
- Red AVAIL - MONTHLY AVG: based on monthly sales avg, available stock is UNDERSTOCKED
- Green AVAIL - MONTHLY AVG: based on monthly sales avg, available stock is WITHIN 20%'
Notes:
- Adding this information will have performance impacts on the reordering screen, due to additional data requirements.
- Credit notes are not included in the calculation of monthly sales.
- The 'Aval - Monthly Avg' by default will be a calculation of the current stock available for the selected site only. By using the 'Rollup Sites' checkbox option in the header section, all your sites available stock levels are included.
