
Accounts Stock Value Period Analysis Tab
For the Other Action Menu options (press F9 or ![]() ) see Accounts Other Actions Menu.
) see Accounts Other Actions Menu.
The [ Accounts | Stock Value | Period Analysis ] tab shows stock movements, ins and outs, within the date range specified. See How To: Create a Stock Value Report for information about creating stock value reports using the sub-tabs in the Stock Value screen. Using the Split Period Analysis enables the user to view the information in the grid by weekly periods. The quantities reported on will include any items either in quarantine or written off from quarantine.
The screen consists of the top filters and the grid.
Period Analysis Filters
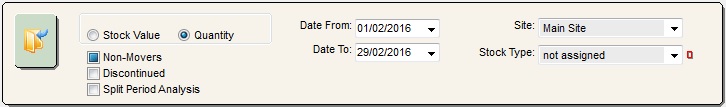
- Go button: the go button must be pressed to populate the grid.
- Stock Value and Quantity radio buttons: view the information in the grid either as Stock Value Quantity; for example 2 stock items or a stock value of 9.98 (2 x 4.99).
- Non-Movers tri-state checkbox:
 (default): all records will be displayed.
 : just display non movers.
 : only display movers i.e. don't display non-movers.
- Discontinued tri-state checkbox (default=unticked): prevents discontinued items being reported on by default.
- Split Period Analysis: changes the information in the grid to display the results broken down into weekly periods based on the date range selected. The figures for each row will be the total Stock Value figures for that weekly period.
Notes:- The week commences on a Sunday.
- Each weekly interval will be displayed as a row in the report generated.
- The first column heading is renamed Week End.
- The Stock Code, Desc, Brought Forward and Carried Forward columns will be removed when this new option is used, but returned when going back.
- Date From and Date To: filter the grid by the specified date range.
Note: the date is the date of the stock movement or adjustment. - Site: define if they would like to only include certain stock items from certain sites set up in Khaos Control.
- Stock Type (
 /
/ traffic light filter): display the information by Level 2 stock type.
Period Analysis Grid
- Stock Code: the stock code.
- Description: short description of the Stock item.
- BrghtFwd: the number of stock items brought forward from the period before the date range specified in the date filter.
- Delivered: all stock items which have been booked in within the date range specified.
- SReturn: all stock items returned to the supplier, which have been returned and a credit note created.
- Adjusted: any adjustments made against the stock item.
- Built: the number of stock items that have been built from child items if applicable.
- Sold: the number of stock items included on issued invoices in the date range specified.
- CReturned: stock items returned by customers and credit notes created and issued.
- WriteOff: all stock written off.
- CarryFwd: the amount of the stock item to carry forward from the date period specified to the next period.
- PeriodDiff: the difference between the bought forward stock amount figure and the carry forward figure, i.e. all activity with the stock item in the period specified taken away from the bought forward figure.
Note: All stock movement figures are relative to the stock level so a positive figure represents stock coming into the system and a negative figure mean stock is leaving the system, hence sold is represented by a negative figure. The CarryFwd figure is the sum of all the columns to the left of it.
Period Analysis Context Menu
- Goto Stock Item...: opens the stock screen for the stock item currently focused in.
- Clear Selection: deselects the currently selected line(s).