
KPI Dashboard
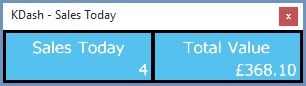
The KPI Dashboard is an extremely useful tool which will enable you to monitor key performance indicators from multiples areas and screens throughout Khaos Control in a floating window that can be kept in view regardless of which screen you happen to be working on. Your stats will be updated in real time, for example sales totals will be updated as sales orders are created. A dashboard can combine KPIs from multiple screens, so a single dashboard could contain Sales, Return, Invoice Management and other data in one view.
Notes:
- In order for the KPI Dashboard to update dynamically,
K-Signalneeds to be enabled on your system. - The KPI Dashboard will only update dynamically when displaying information from
K-Signalactive screens. For more information, please see K-Signal.
The KPI Dashboard is set up and configured using two different dialogs. The first is accessed from the grid containing the data you want to monitor, using the grid menu ![]() and selecting
and selecting Tools | Add to Dash.
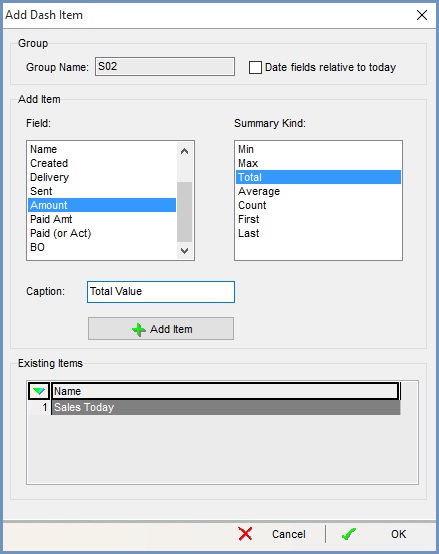
This dialog allows you to add the data you're interested in from the open screen into the dashboard.
- Group Name: here you can enter a group name. You can create groups of different data items from the same screen that can be displayed simultaneously, for example Sales Order count and Total Value.
- Date fields relative to today: when this option is
 ticked, any date range selected for the data you are monitoring will be relative to the date you are viewing the data. For example, if you set up your screen to show sales for the previous week and add the total to your dashboard, it will always show the last week's worth of sales, relative to the date you are viewing the dashboard.
 - Field: this is where you can select which field (usually a column) contains the data you want to monitor.
- Summary Kind: this is where you can select how you want the data to be displayed, for example as a total, average, count, etc..
- Caption: here you can add a short text description of what the data shows, for example 'Fred's Sales', 'Value in Awaiting Stock', etc..
- Add Item: adds the selected data field and summary kind into the group. Any items already in the group will show in the Existing Items grid.
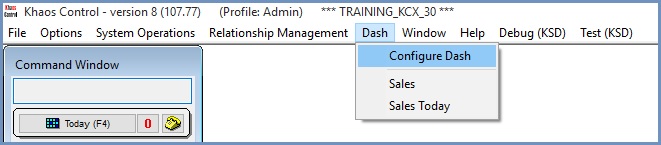
Once you have selected the data items you wish to monitor, you need to configure the KPI Dashboard display itself, and this is done from the Configure Dash dialog, which is accessed from the Dash option in the menu bar.
This will open the Configure Dash Display dialog:
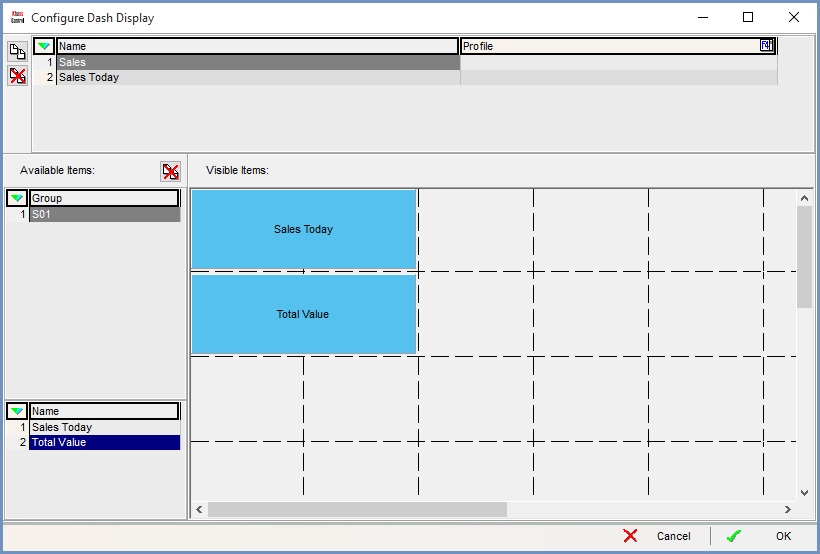
This is where you can build your KPI Dashboard displays.
- Upper Panel: this is where you can create and name your Dashboard displays.
Note: if you define a profile against a display, it can only be viewed by users within that profile, or by Admin users. - Available Items panel: shows the groups and data items you created in the Add to Dash dialog.
- Visible Items panel: contains the data items you have dragged and dropped from the Available Items panel. These can be positioned and arranged using the grid lines and will specify the data items shown in the KPI Dashboard display focused on in the upper panel.
You can view your Dashboard by clicking on its name after selecting the Dash option in the menu bar.
More information about how you can utilise and get the most out of KPI Dashboard can be found on the following pages:
- How To: Add data to a Dashboard.
- How To: Configure a Dashboard.
- How To: View a KPI Dashboard
- KPI Dashboard Example - Counting Orders By Sales Source
- KPI Dashboard Example - Counting Orders By User