
Sales Order Statistics
What is the Sales Order Statistics Dialog?
The Sales Orders Statistics dialog allows users to view the average frequency and value of sales orders over a specified date range. It is similar to the [ Sales Summary | Charts ] and [ Sales Summary | Management Reports | Sales Analysis ] screens.
Note: the sales orders do not need to be issued to appear in this popup, just created and saved.
What are the Benefits of Using the Sales Order Statistics Dialog?
The numbers and values of sales orders can be viewed over a specific period and then tweaked to see the values within a more recent period. The grid can be sorted, information can be printed out and customers added to a call list.
Where is the Sales Order Statistics Dialog?
The Sales Order Statistics dialog is loaded from the Sales Order screen's "Other Actions menu:
- Open a Sales Order screen.
- Display the drop-down 'Other Actions' menu either by pressing F9 or clicking the down arrow immediately to the right of the
 green circle with a white cross icon at the top of the button bar.
 - Select "Sales Statistics"
The Sales Order Statistics Dialog
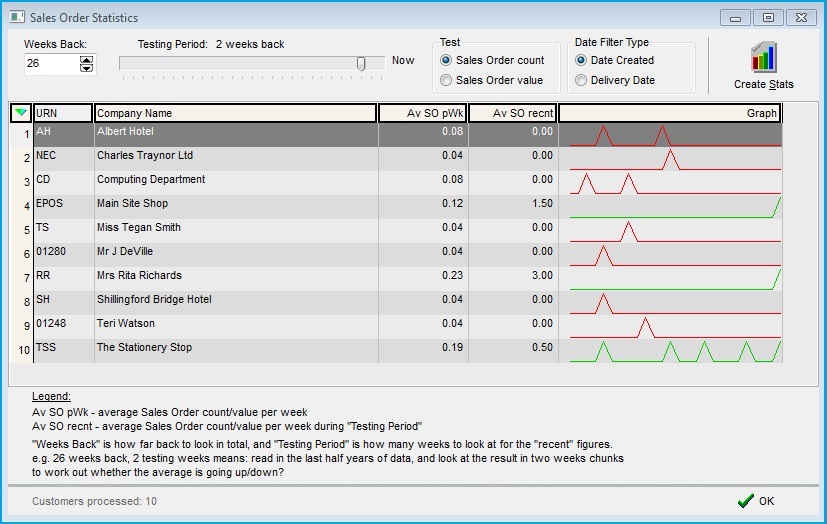
The Sales Order Statistics dialog consists of top filters, a grid, a legend and a lower information area.
Top Filters
- Weeks Back: how far back in weeks to review the sales orders.
- Testing Period: the number of weeks to review retrospectively within the Weeks Back period. The slider can be moved along to increase the number of testing period weeks with the number of weeks displayed above the slider.
- Test:
- Sales Order count: look at the numbers of sales orders.
- Sales Order value: look at the values of sales orders.
- Date Filter Type: filter the date range based on either:
- Date Created: the date the sales order was created; or
- Delivery Date: the date the sales order has been or is due for dispatch.
-
 button: populates the grid according to the the chosen settings.
Sales Order Statistics Grid
- URN: the URN of the company.
- Company Name: the name of the company.
- Av SO pWk: the average Sales Order count or value per week.
- Av SO Recnt the average Sales Order count or value per week during the testing period.
- Graph: compares the Av SO Recnt to the customer's Av SO pWk.
- Red: the line will be red if the average recent Sales Orders are less than the average sales orders per week multiplied by 75%.
- Green: the line will be green if the average recent Sales Orders are greater than the average sales orders per week multiplied by 75%.
- Grey: the line will be grey if the values fall between the red and green values i.e. average recent Sales Orders are equal to the average sales orders per week multiplied by 75%.
Sales Order Statistics Grid Context Menu
- Goto Customer...: opens the
[ Customer | Detail | General ]screen for the customer currently focused on. - Add to Call List: opens the Add To Call List Dialog enabling the user to add the selected customers to a call list.
- Clear Selection: deselects the currently selected line(s).
Legend and Information Area
The Legend explains the settings and less obvious grid headings. The information area lists the number of customers who have been processed.
How to use the Sales Order Statistics Dialog
- Open a Sales Order screen.
- Click on the button on the button bar.
- In the Sales Order Statistics dialog select the number of weeks you wish to review the sales statistics for by either using the spinners on the Weeks Back option or entering a number directly into the Weeks Back field.
- Select to test by clicking on either:
- Sales Order count or
- Sales Order value
- Select the date filter by clicking on either:
- Date Created or
- Delivery Date
- Click on the button.
- The grid is populated and the total number of customers processed is displayed below the grid.
Using the Filters
- Click on the Sales Order count and Sales Order value radio buttons to view the number of sales orders and the total values per customer. The grid will automatically update according to the radio button selected.
- Move the Testing Period slider from Now on the right to see figures for more recent periods within the number of weeks back.
- Change the Date Range filter to see the difference between the date the order was created and the delivery date.
Note: the grid contents can be printed out using the Print Grid and Send to Notepad options. The printouts do not include a graph but the numerical value.