
Using Sales Summary to Report on Lost Demand Items
What is Sales Summary?
Sales Summary is a powerful tool that can be used to analyse past sales and supplier purchases. This information can be filtered to give users fine control over the data that is returned. There are 10 tabs, the most commonly used being:
- Best Sellers tab for viewing stock sales.
- Customers tab for customer sales information.
- Invoices tab for both sales and purchases.
- Payments tab for payments received and paid out.
Once the user has returned the results in a grid they can either print the report or send the information to Notepad, see Printing the Results below.
What is Lost Demand?
Lost Demanding a stock item is used when the sale of an item is lost due to insufficient stock being available to meet the customer's requirements, see How To: Lost Demand an item on a Sales Order.
Note: if a whole sales order has been lost demanded then the items will NOT show in Sales Summary as lost demand, see How To: Lost Demand a Whole Sales Order.
Benefits of Using Sales Summary to Report on Lost Demand Items
Using Lost Demand, rather than just deleting the item off the sales order, means that it can be reported on in the [ Sales Summary | Best Sellers ] screen. This information can be used to review the quantities of items purchased, update the Safe and Minimum levels against the stock items or review the suppliers the items are purchased from.
How to Access Sales Summary
The [ Sales Summary | Best Sellers ] screen can be opened using the following methods:
- Type "ss" into the command window; or
- Select "Sales Summary" from the window list; or
- Click the red "Ss" menu button
 .
.
Sales Summary will open with the [ Best Sellers ] screen displayed as it is the first screen in Sales Summary.
Examples of Using Sales Summary to Report on Lost Demand Items
The Best Sellers tab is used to view stock items that have been marked as Lost Demand in sales orders. The grid displays the financial breakdown of Stock Items or Stock Types using the filters, for example viewing the quantities of stock items sold on a website or quantities sold by a specified brand.
There are two filters that can be used to display Lost Demand items:
- Include Lost Demand: will display all stock sold during the period selected as well as Lost Demand items.
- Show Lost Demand (only): will only show Lost Demand items during the period selected.
Note: items marked as Lost Demand will display with a mauve background.
Include Lost Demand
- Open a Sales Summary screen..
- On the
[ Sales Summary | Best Sellers ]screen click on the Filter button in the top left.
 - Change the date range as required, in the example it is 01/06/2016 to 17/06/2016.
Note: the date can be the Issue Date, Invoice Date or Delivery Date depending on the radio button selected. - Click on the Add New filter drop down and select Include Lost Demand. This filter will be added to the list of filters, see the image below:
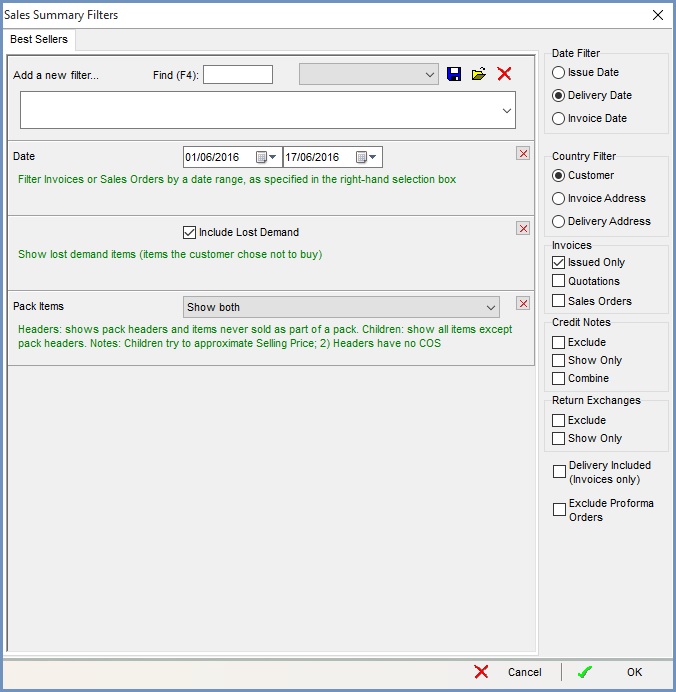
- Tick the Include Lost Demand checkbox.
- You may wish to Exclude Credit Notes using the checkbox on the lower right.
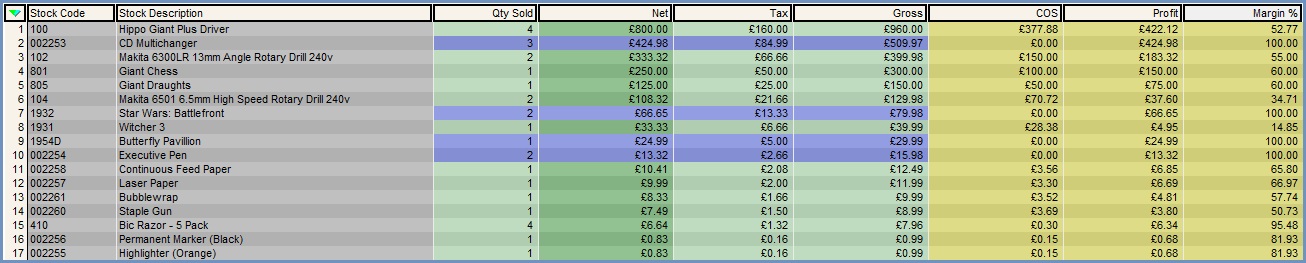
- Click on OK, the results include both items that have been sold as well as the Lost Demand items which will have a mauve background:
Show Lost Demand (Only)
- Open a Sales Summary screen..
- On the
[ Sales Summary | Best Sellers ]screen click on the Filter button in the top left. - Change the date range as required, in the example it is 01/06/2016 to 17/06/2016.
Note: the date can be the Issue Date, Invoice Date or Delivery Date depending on the radio button selected. - Click on the Add New filter drop down and select Show Lost Demand (Only). This filter will be added to the list of filters, see the image below:
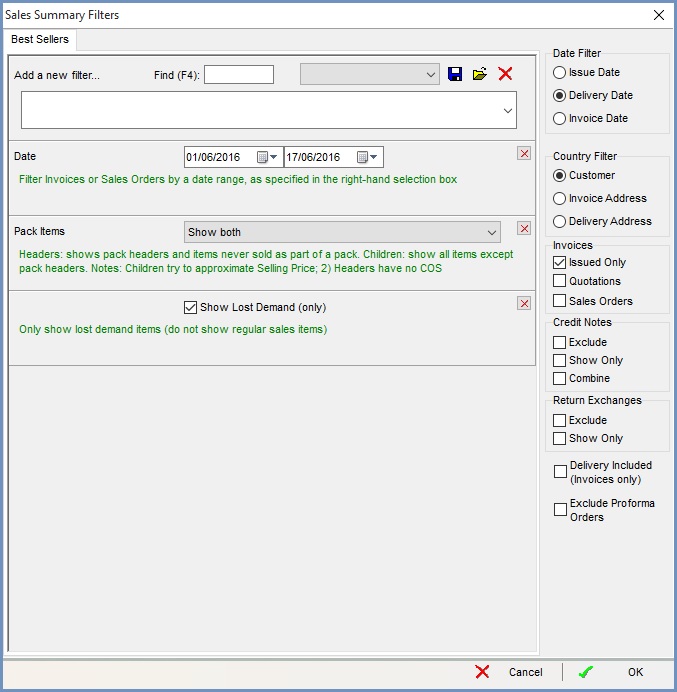
- Tick the Show Lost Demand (Only) checkbox.
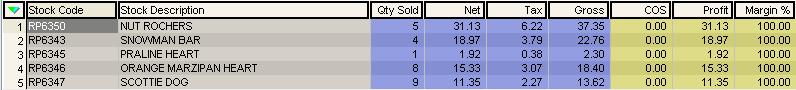
- Click on OK, the results show the Lost Demand items which will have a mauvebackground:
Printing the Results
The results can be printed using the following options:
- Send to Notepad allows the user to send all or only selected data in the Grid to Notepad for saving to external files, printing or importing into a spreadsheet program.
- Print Grid allows the user to display a report listing the information in the grid.
- Press Ctrl+P or click
 to print. and select 'Print Report (if any)...' from the options. This displays a report listing the information in the grid.