
Accounts Profit and Loss Tab
For the Other Action Menu options (press F9 or ![]() ) see Accounts Other Actions Menu.
) see Accounts Other Actions Menu.
The Profit & Loss (P&L) report categorises the income and expenditure of the business over accounting periods. The information can be broken down by periods (months, quarters, years) and by nominal classification. Being able to break down the information by nominal classifications allows the user to view nominal classifications, for example branches or departments, over a number of periods so the results can be compared. The P&L can be printed see How To: Print the P&L
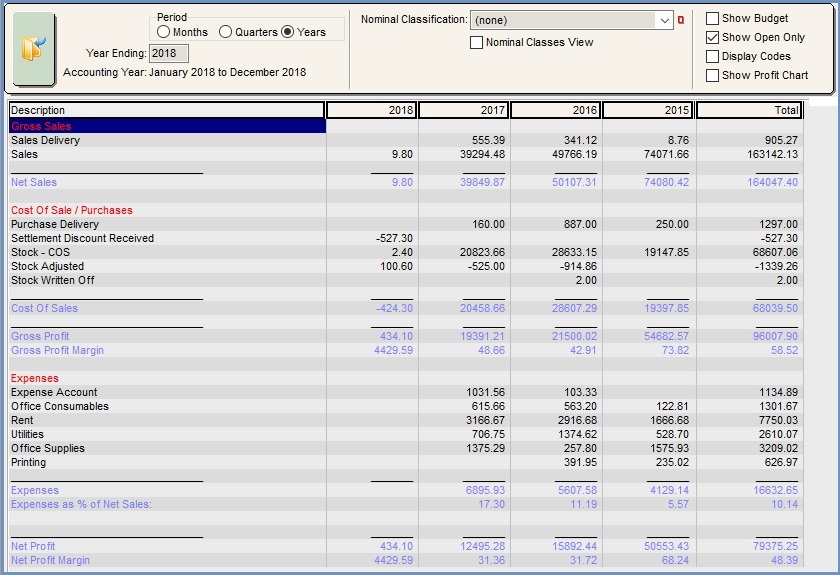
As described below, the P&L report details "Gross Sales" and discounts, giving "Net Sales"; it then details "COS & Purchases", resulting in "Gross Profit" and the "Gross Profit Margin" (Gross Profit / Net Sales * 100); then Expenses are detailed resulting in the bottom line "Net Profit" figure.
Using Currencies
When using currencies there maybe differences between the value shown in this screen and the [ Customer/Supplier | Detail | Statement ] screen. This is because the [ Customer/Supplier | Detail | Statement ] screen shows the combined after allocation total for that customer, whereas the profit and loss for the Sales shows the raw figure which hit the sales nominal.
The details of this can be seen in the [ Customer/Supplier | Detail | Statement ] screen by right-clicking in the Statement Transactions grid and selecting Show Journal Details. The dialog shows the details of the posting including currency loss/gain postings. If more than one allocation is made, this will result in multiple entries.
Currency loss/gains are not flagged against nominal classifications so can't be seen in the nominal classification breakdown.
Currency loss/gains don't change the raw postings to the nominal and only affect the relevant debtors / creditors figures.
Budgets
The budgets functionality in Khaos Control allows users to set up monthly budgets against different nominal accounts and then analyse them in this grid, see How To: Set up Budgets against Nominal Accounts and How To: Analyse Budget Figures.
Profit and Loss tab
The Profit and Loss tab contains two areas:
- Top filters
- Grid
Filters
Across the top of the sections are the controls and filters:
- Months, Quarters, Years: switches the P&L view between these periods.
- Year Ending: to view a Profit & Loss for a different accounting year, select a year and click the Refresh or Go button. Remember that your financial year is defined in
[ System Values |General | Defaults and Financial ]tab. - Nominal Classification: (
 /
/ traffic light filter) filters the P&L so it only displays transactions with that nominal classification assigned to it.
 - Nominal Classes View: enables the user to display mini P&Ls, depending on the number of periods (months, quarters, years) selected, so comparisons can be made between them. Ticking this checkbox exposes the
 button allowing the Nominal Class View Setup dialog to be displayed enabling the user to define how they wish to display their nominal classes, see How To: Display Nominal Classifications as Columns in the Profit and Loss and How To: View Branches in a Mini P&L.
 - Show Open Only:
- TICKED: ONLY data from open accounting periods is displayed. Date from a period that has been cleared down will not be displayed.
- UNTICKED: ALL data within an accounting period will displayed regardless of whether it has been cleared down or not.
- Display Codes checkbox: if ticked the nominal codes will be displayed by the nominal description.
- Show Profit Chart: Displays a line chart which plots the relative profit totals based on the period selected see Profit Chart below.
Notes:
- The Go button must be pressed after changes to the controls and filters.
- When viewing previous years that have been closed make sure the Show Open Only checkbox is not ticked.
P&L Grid
- Description: names of active nominals depending on the current filters broken down under the following headings:
- Gross Sales
- Net Sales
- Cost Of Sales / Purchases
- Cost Of Sales
- Gross Profit
- Gross Profit Margin
- Expenses
- Expenses
- Expenses as % of Net Sales
- Net Profit
- Net Profit Margin
- Net Sales
- Gross Sales
- Month 1 - 12 / Quarter (20??) / Year: Year Endings Month, Quarter on Year column depending on radio button selection.
- Total: is the total for each nominal/entry.
Context Menu
- Send to Notepad: Send the contents to Notepad for saving to external files, printing or importing into a spreadsheet program.
- Clear Selection: deselects the currently selected line(s).
- Note: Selecting lines will total that selection at the bottom.
P&L Drill-down
To drill down the entries in the P&L grid double-click on the values to open the Drill Down grid on the right listing the entries that make up the value. The Drill Down grid contains one filter:
- Apply Nominal Class Filter: to filter nominal classifications.
Note: to close the P&L Drill-down grid click on the green arrow at the bottom of the grid.
P&L Drill-down Grid
The grid has the following headings:
- Note: as entered against the individual entry.
- Debit: Monies entering a nominal.
- Credit: Monies leaving a nominal.
- Date: the date of posting.
- Journal ID: the journal ID for the entry.
- Classification: the nominals classification if used.
- Stock Item: the stock item associated with the entry if applicable.
P&L Drill-down Context Menu
- Show Journal Pop-up: displays a dialog to show all of the nominal accounts that made-up the double-entry to which the selected transaction belongs (see How To: View Journal Details).
- Clear Selection: deselects the currently selected line(s).
- Note: Selecting lines will total that selection at the bottom.
Print the P&L
To Print the P&L report click on the Print icon on the screen's button bar.
Profit Chart
When the Show Profit Chart checkbox is ticked a window opens in the lower screen with the data represented in a line chart format. There are options to:
- Line Chart: change the format between a line chart (ticked) and a bar chart (unticked).
- Filter the information displayed using the drop-down list:
- Net Profit
- Gross Profit
- Sales
- COS
- Expenses
Nominals Included in the Profit and Loss
The following user-created nominal codes would normally appear in the Profit and Loss report:
- Sale
- Sales Discount
- Purchase
- Cost of Sale
- Expense
- Other income