Report Builder
- WARNING: Before making changes to ANY of your Basic Report templates it is advisable to take a backup.
Khaos Control's Basic Reports uses only the Report Design tab, not the entire ReportBuilder utility. Although Report Builder has been incorporated into KhaosControl some features are not available and you may be limited by which fields are available to use depending upon the template you are working with.
Report Builder Designer
| | Report Builder Designer is an Advanced User feature. |
Report builder designer is accessed by clicking the ![]() button from the report design dialog box.
button from the report design dialog box.
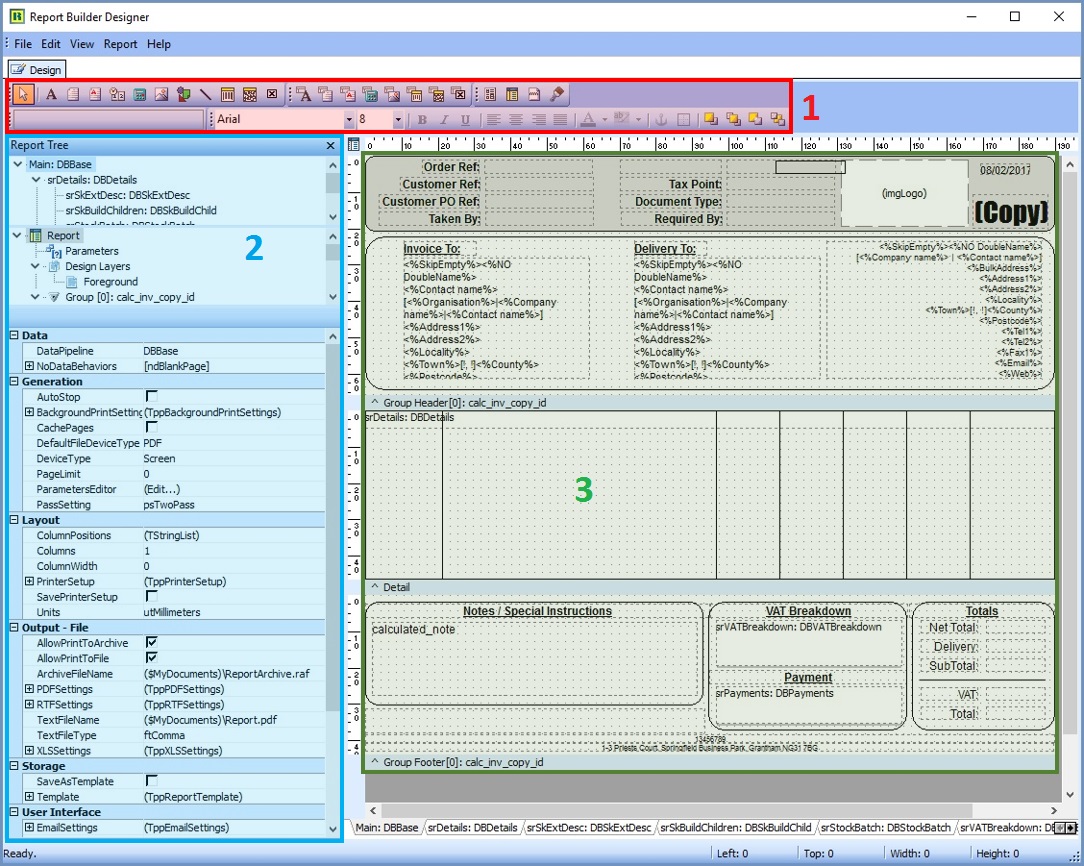
There are 3 main areas of the Report Builder Designer.
- The Component Palette Toolbars - Used to create new components.
- The Report Tree - Contains 2 areas, the Data Pipelines and the Object Inspector
- The Design Area - The report design area

The Component Palette Toolbars
These toolbars are used to create new components. To create a component, click on the icon and then click in the white space of the design area. There are five component toolbars:
- Standard: Use the Standard components to create text, lines, shapes, memos, richtext, etc.
- Data: Use the Data components when you want to display the data from a database.
- Advanced: Use the Advanced components when you need to create more complex reports using subreports, regions, or crosstabs.
- Edit: The Edit toolbar allows you to set the most important property for a given component. For example, when a Label component is selected an edit box appears that allows you to set the Caption. When a DBText component is selected, two drop-down lists appear that allow you to set the Data Pipeline and the DataField.
- Format: This toolbar appears to the right of the Edit toolbar. It's used to configure the font of textual components and to control component layering via the Bring to Front and Send to Back commands.
For more detailed information see: Report Builder Designer - Component Palette Toolbars.
The Report Tree
You can display the Report Tree by selecting the View | Toolbars | Report Tree menu option. This tool window is dockable on the left and right sides of the Report Designer. The top pane contains a tree view of the Report layout. The bottom pane of the Report Tree contains the Object Inspector which can be used to view and modify properties of the currently selected object.
- You can use the Report Tree to see exactly what components are contained in the report and to select individual components.
- Use the Object Inspector to view and modify properties of the currently selected object. When multiple objects are selected, the Object Inspector filters the property list to show the properties that are common to all selected objects. Modifying a property value will update all selected objects.
The Design Area
The Report Designer is actually a sophisticated component editor for the report component that you to quickly and easily lay out complex reports.
In ReportBuilder, when you place a ReportBuilder component from one of the Report Designer's component palettes on a report band, three things happen:
- The component is drawn on your report layout.
- The component is added to your form unit (.pasfile).
- The design-time properties and events of thecomponent become visible in the Object Inspector
Designer Tips
- Always change the default name of a new component. This makes them easier to locate if you need to modify them later.
- Some components are a mandatory requirement of the report. To be safe, do not delete the default components, simply select the Hide property.
- Save your changes regularly, using 2 versions. That way if the latest changes you just made cause an error, not all of your work is lost.
See also
- Report Builder Designer - Component Palette Toolbars
- Basic Reports
- System Operations - Basic Reports Setup
- Basic Reports - Available Data Fields
